Exploring Data with Python
Python is a programming language that is known to be an easy language to learn and use. Also, there is a large Python community across the globe which can assist with various coding challenges.
In this article we will discuss the ease of getting data to analyze and explore visually. This tutorial is suited for anyone with an interest in Data Science and/or Machine Learning.
To get started it is assumed you have Python (3.4 or higher) installed on your computer and a text editor (such as Jupyter Notebook, Spyder, VS Code). In this article Jupyter Notebook is used.
Getting Your Data
There are various data sources, far more organizations (companies, government agencies, and non-profits) are making data available. Please see my article on Locating Data for Building Models for more details.
In this tutorial we will use the iris dataset available with sklearn. Make sure you have access to the following libraries by opening a command line prompt and installing the following libraries:
pip install numpy pandas matplotlib seaborn sklearn
Once the libraries are installed, open your text editor and import the libraries:

Great, the libraries are available for use. We can now read in the data from the sklearn dataset and look at the data.

Note by entering the command on line 1, (as depicted above) it reads in the iris dataset directly from the sklearn library and places it in a pandas dataframe. The X_iris variable contains the features (as displayed in the list of columns) on line 2; the y_iris variable has the species for the data, (labelled as 0, for setosa, 1 for versicolor, and 2 for virginica).
In data modeling the X_iris variables (also known as the features) is used to predict the y_iris variable (known as the label or predictor).
Since the data has been successfully read in we can now get detailed information about the data. For instance, we can look at the detail of the X_iris variable:
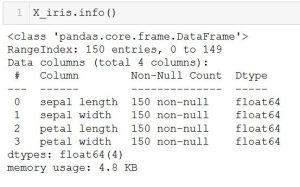
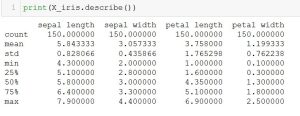
We can also see information on the y_iris variable. As shown, y_iris has 3 unique variables  (specifically: 0, 1, 2–Setosa, Versicolour, Virginica) which represents the name of the 3 iris species.
Exploratory Data Analysis is an area of Data Science that leverage visualization tools to identify patterns and summarize them. Python makes EDA simple or as complex as needed. Here we are going to review a few common approaches to EDA which take 1 or 2 lines of code.
Below is a pair plot of the X_iris variable (the features).
A pairplot is a great tool that depicts correlation, distrubtion, skewness, and kurtosis compared to each feature. Taking a look at sepal length first row, first column show 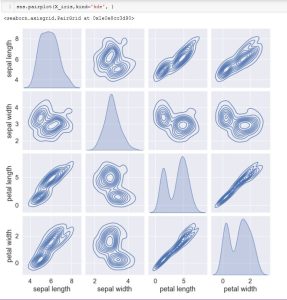 the distribution for each feature (diagonally). In the same row (sepal length, sepal width) show a negative correlation with a greatly dispersed. However, sepal length in the last 2 columns (petal length, petal width) shows a positive correlation of sepal length to petal length as well as sepal length to petal width.
Seaborn pairplot is a powerful tool that can display multiple features in a single line of code. The parameters, such as the “kind=” parameter can be changed to other options in order select a different look.
The Seaborn heatmap can be used to quickly view the correlation between features. The 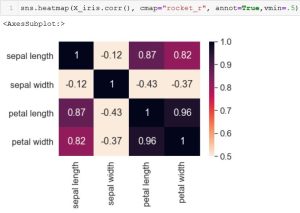 heatmap below depicts annotations and the colorbar, which identifies the higher ranges (the darker colors) as a high correlation versus the lower ranges (the lighter colors) as having a lower correlation.
As depicted, sepal width (the 2nd row and 2nd column) has a negative correlation to all other features–except itself, of course. This supports the pairplot analysis, as stated above.
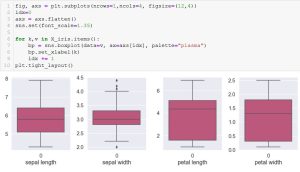
Lastly, we leverage seaborn to depict the ranges for each of the features of the X_iris variable. This graph depicts a boxplot for sepal length, sepal width, petal length, and petal width.
Conclusion
In summary, Python is a popular general purpose programming language that can analyze data and visualize data with ease and/or complexity, as deemed necessary by the developer. I hope this help those seeking to delve into Data Science.
Yes, you can!
Mandy Bohler, Senior Data Scientist
